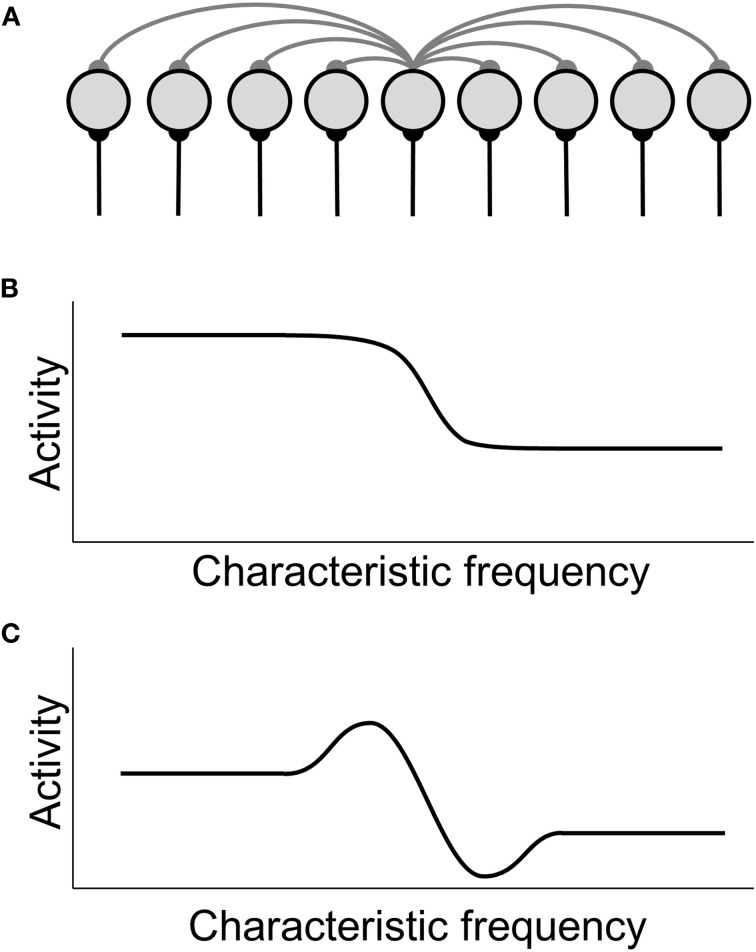
Figure 1.
Schematic illustration of lateral-inhibition models. (A) Depiction of a layer of neurons with lateral inhibition. Neurons are represented by gray circles, lateral inhibitory connections by gray lines (only the inhibitory projections from the central neuron to its neighbors are shown), and excitatory afferents by black lines. (B) Hypothetical auditory activity pattern with a drop toward high frequencies, as it could for example occur in the spontaneous activity of the auditory nerve after noise-induced hearing loss. (C) Activity pattern in the lateral-inhibition network driven by the input shown in (B). An activity peak is generated at the edge of the input pattern but below the region of hearing loss.

