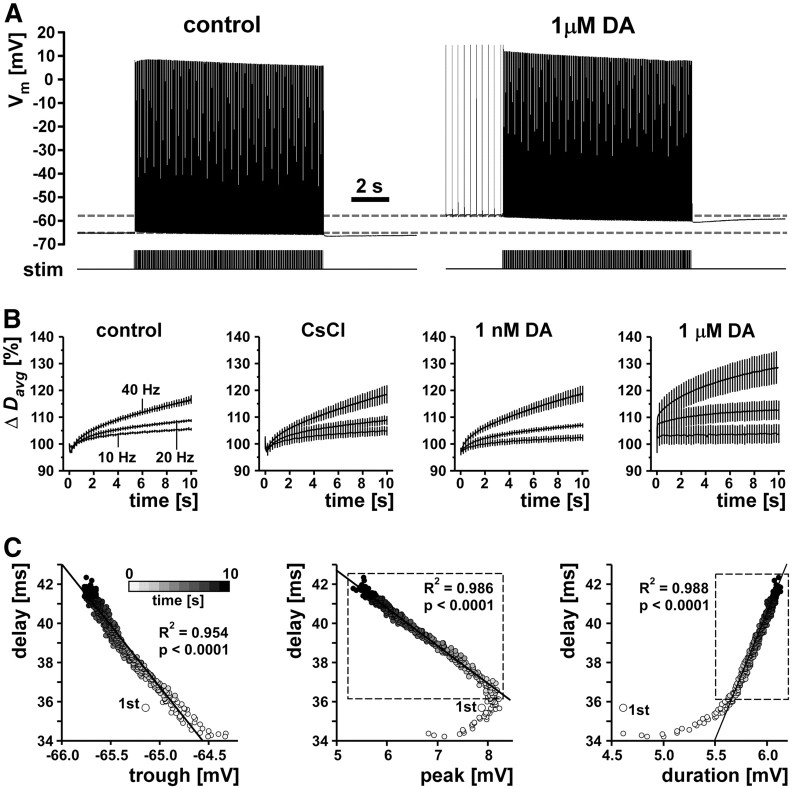
Figure 3.
Conduction delay changes during tonic stimulation. A, Example traces from 10 s/40 Hz stimulations in control saline and 1 μm DA. B, Plots of mean change in delay (Δ Davg) over the 10 s stimulation for three different tonic stimulation frequencies (10, 20, 40 Hz) in control, CsCl, and the two DA concentrations (n = 5). For legibility, only one in eight error bars are shown. C, Delay as a function of spike shape (example plots from 1 experiment in control saline). Gray shading indicates time bins from 1–10 s. Values from the first stimulus are plotted as larger dots and labeled “1st.” Lines represent linear fits from regression analysis, and R2 and p values are given in the figure. For the correlation between peak voltage and delay, and spike duration and delay, only data from the 2nd to 10th second were used (dashed box).

