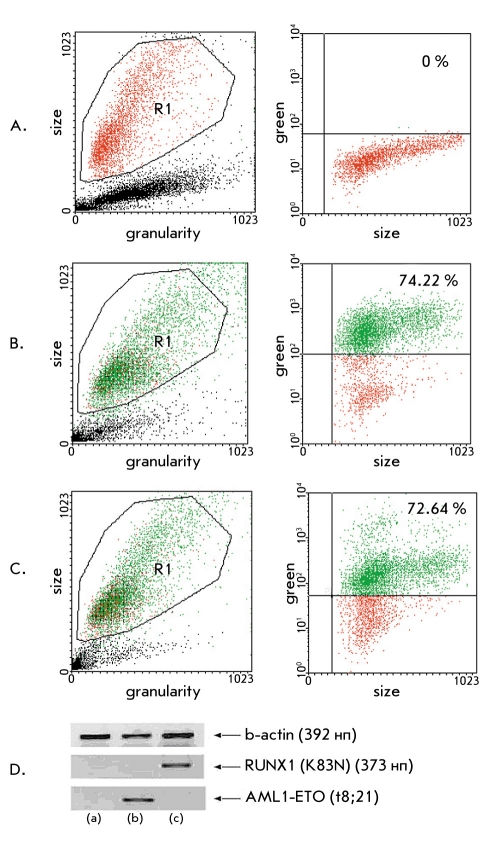
Fig. 1.
Efficiency of transgene expression in cell lines transduced with AML1-ETO- and RUNX1-K83N-expressing recombinant retroviral vector particles; (A) Histogram of nontransduced SC-1 murine fibroblast cell line, (B) Histogram of SC-1 murine fibroblast cell line transduced with RUNX1-K83N expressing retroviral vector particles (74,22 % of the population shows increased fluorescence), (C) Histogram of SC-1 murine fibroblast cell line transduced with AML1-ETO expressing retroviral vector particles (72,64 % of the population shows increased fluorescence). The absolute values of the size of each event analyzed (cell) is shown along the X axis, while the absolute values of the intensity of fluorescence of each event (cell) is shown along the Y axis. Every third histogram in each row is divided into 4 quadrants; the upper right quadrant contains cells expressing eGFP and AML1-ETO, while the lower right quadrant contains cells that do not express eGFP and AML1-ETO. (D) RT-PCR (from left to right; (a) non transduced SC-1 cell line, (b) SC-1 cell line transduced with RUNX1-K83N expressing retroviral vector particles, (c) SC-1 cell line transduced with AML1-ETO expressing retroviral vector particles)

