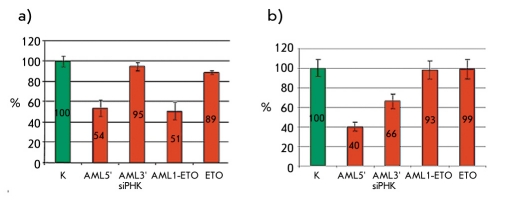
Fig. 2.
Results obtained after flow cytometric analysis of cell suspensions. The percentage of fluorescent cells in the population of different siRNA transfected cell lines is shown. A) The percentage of fluorescent cells in the AML1-ETO expressing murine fibroblast cell line 48 hours after transfection with various siRNA duplexes. B) The percentage of fluorescent cells in the RUNX1(K83N) expressing murine fibroblast cell line 48 hours after transfection with various siRNA duplexes

