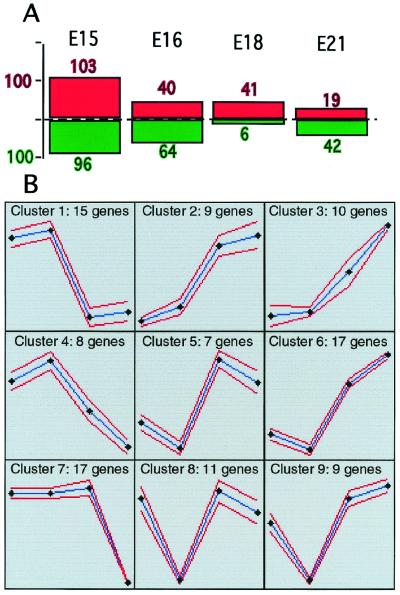
Figure 1.
Gene expression patterns during normal bursal development. (A) Chart of numbers of mRNAs showing at least 3-fold increases (red) or decreases (green) at embryonic days 15, 16, 18, and 21, compared with 2 weeks after hatching. (B) SOM (17) of 103 mRNAs showing at least 3-fold or greater changes at embryonic day 16 (E16) relative to 2-week posthatching bursa. The expression level of each gene was normalized to have a mean = 0 and SD =1 across time points. Each cluster exhibits an average pattern (blue) and SD for this average (red). Relative expression levels are shown on the y axis and four time points (E15, E16, E18, E21) on the x axis.

