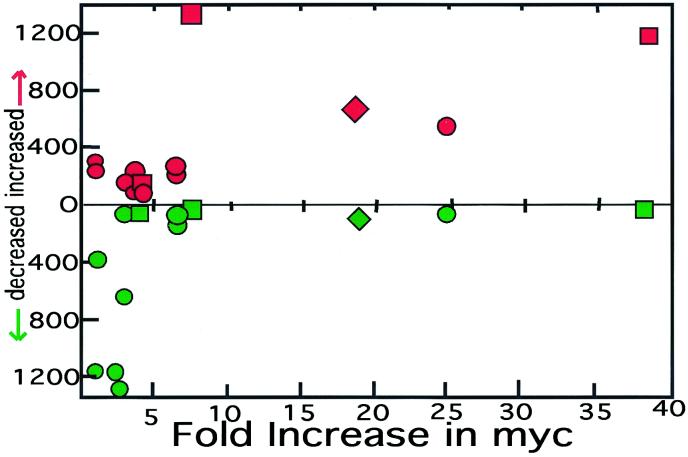
Figure 2.
Relationship of level of myc-oncogene expression to change in expression of other mRNAs on the array. The number of mRNAs (y axis) showing 3-fold or greater increased (red) or decreased (green) expression, relative to the 2-week NB reference, for three TF preparations (squares), eight metastatic tumors (circles), and the DT40 cell line (diamonds). The fold increase in myc expression, determined on the array for each sample, is displayed on the x axis.

