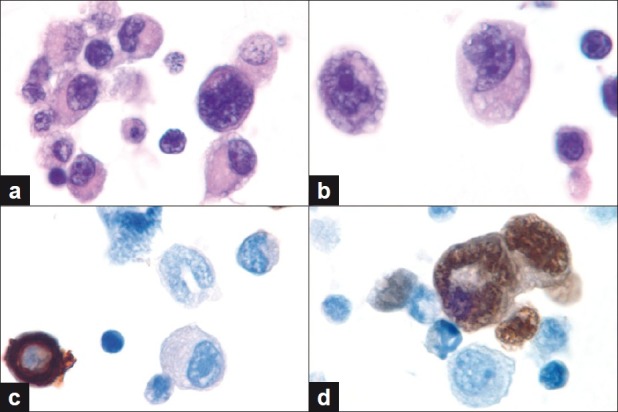
Figure 3.

(a, b) Cell block findings showing neoplastic cells admixed with reactive mesothelial cells and lymphocytes. Note the hyperchromatic nuclei and prominent nucleoli of the neoplastic cells. (c, d) Immunoperoxidase studies for cytokeratin AE1 / AE3 and myogenin show lack of tumor cell staining for CK and nuclear positivity for myogenin. Mesothelial cells show the opposite staining pattern. (a,b: Hematoxylin and Eosin, c,d: Immunoperoxidase stains, all images original magnification, ×1000)
