Fig. 1.
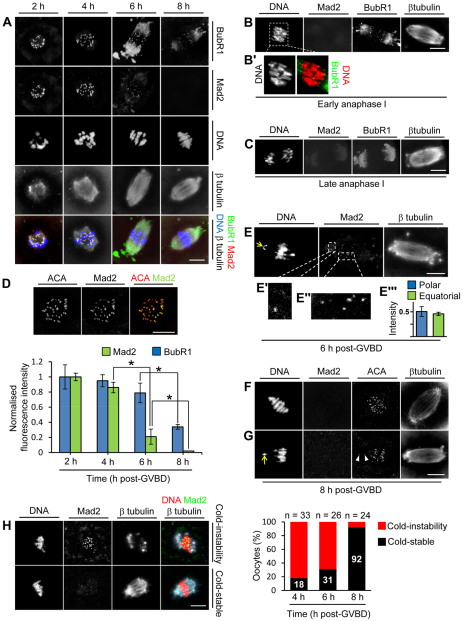
Equatorial location and K-fibre formation are not prerequisites for Mad2 displacement. (A-C) z-projections of mouse oocytes immunostained for BubR1, Mad2 and β-tubulin. DNA was stained using Hoechst 33342. (D) Quantification of kinetochore Mad2 and BubR1. Oocytes were double labelled for Mad2 or BubR1 plus anti-centromere antibody (ACA) at all four time points on the same day and z-stacks were acquired using identical settings within a subvolume spanning the entire kinetochore-containing region as illustrated. Background-corrected total integrated fluorescence intensity for a region of interest (ROI) was determined at ACA foci and for the corresponding ROI in the Mad2 and BubR1 channels. Mad2:ACA and BubR1:ACA ratios were determined for more than 200 kinetochores per time point (three experiments) and normalised to the intensity at 2 hours post-GVBD. Data are mean ± s.e.m.; *P<0.05 by Student’s t-test. (E-E″′) An oocyte at 6 hours post-GVBD shows a polar-displaced bivalent (arrow) with levels of Mad2 (E′) that are comparable to those at equatorial bivalents (E″). (E″′) Mad2 fluorescence intensities at polar kinetochores (n=8) and equatorial kinetochores (n=73) from four oocytes at 6 hours post-GVBD. Data were normalised to the maximal intensity within each oocyte. Data are mean ± s.e.m. (F,G) Mad2 is undetectable by 8 hours post-GVBD regardless of chromosomal position. Note the absence of Mad2 at kinetochores (arrowheads, G) of a polar-displaced bivalent (arrow, G). (H) Cold-stable microtubule content. Immunostained images depict two phenotypes after cold treatment: the ‘cold-instability phenotype’ (microtubule depolymerisation and high Mad2) and the ‘cold-stable phenotype’ (stable microtubules and low Mad2). Scale bars: 10 μm.

