
Fig. 3.
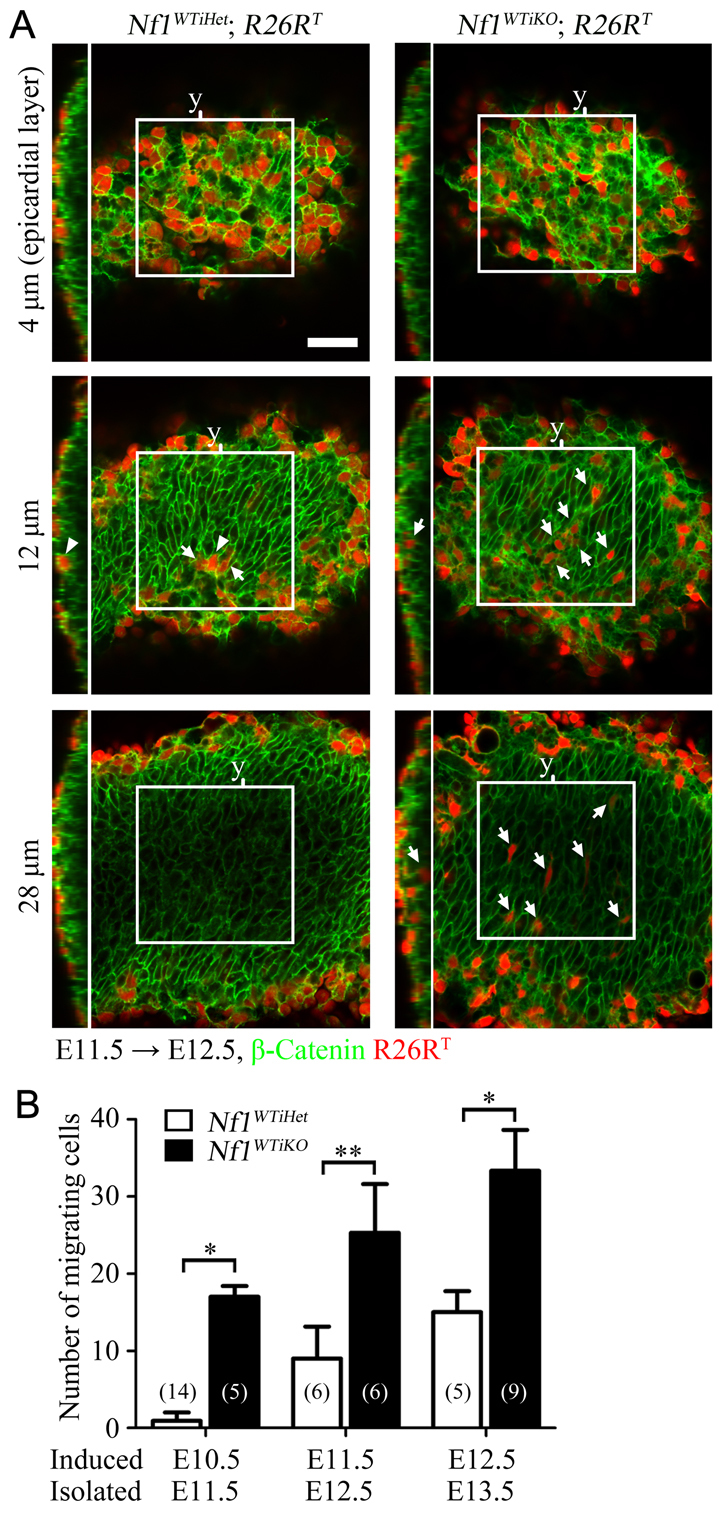
Early and increased EMT in vivo upon the loss of Nf1 in epicardial cells. (A) Representative whole-mount confocal optical sections of the indicated genotype. Induction by tamoxifen was at E11.5, hearts were isolated at E12.5 and whole-mount-stained for β-catenin to distinguish individual cells. z-stack images were taken from the epicardium (defined as 0 μm) using a confocal microscope. Nine consecutive images of 4 μm optical thickness spanning a total of 32 μm were taken in similar regions of the heart left ventricle. Examples at 4, 12 and 28 μm depth are shown. Boxed regions indicate the area used for quantification (150 μm × 150 μm). An orthogonal view of the indicated y-axis (y) of each z-stacked image is shown to the left. Arrows indicate examples of migrated cells in the heart ventricular region. Arrowheads indicate cells in the epicardium. See supplementary material Fig. S3 for examples of the full panel of images at each tracing time point. Scale bar: 50 μm. (B) Quantification of R26RT-positive cells in the myocardial region of hearts at the indicated tracing time points. The number of R26RT-positive cells in the left ventricular region of the myocardial area (150 μm × 150 μm × 32 μm) was counted using ImageJ. Data are mean ± s.d. n values are indicated in parentheses. *P<0.0001; **P<0.0005.