Fig. 6.
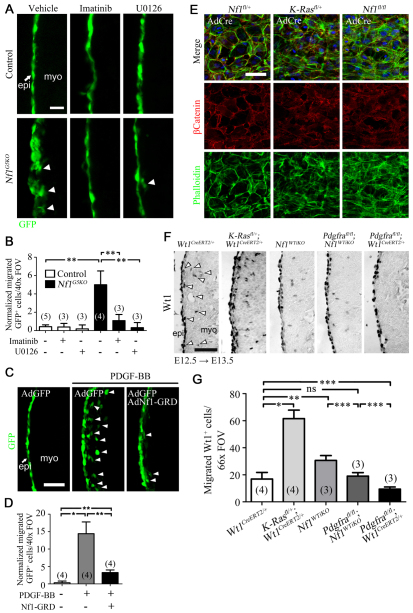
Regulation of epicardial EMT by Nf1. (A,C) Representative GFP fluorescence images of the ex vivo migration assay. E12.5 mouse hearts were cultured and epicardial cells were labeled by adenoviral GFP transduction. Arrowheads indicate epicardial cell migration. Arrow indicates epicardium (epi); myo, myocardium. (A) Hearts were treated with 2 μM imatinib mesylate (a potent inhibitor of both Pdgfrα and Pdgfrβ) or U0126 (an inhibitor of both Mek1 and Mek2) where indicated. Hearts were cultured for 2 days before analyzing migration by GFP fluorescence. (C) Hearts were cultured in the presence or absence of Nf1 GAP-related domain (Nf1-GRD) adenovirus. After 18 hours, recombinant PDGF-BB was added to a final concentration of 20 ng/ml. Hearts were then cultured for 2 more days before analyzing migration by GFP fluorescence. (B,D) Quantification of migration in A and C, respectively. Migrated GFP+ cells were quantified and normalized by multiplying by adenoviral transduction efficiency (GFP+ cells in epicardium/total number of epicardial cells in a 40× field of view). Data are mean ± s.d. n values are indicated in parentheses. *P<0.0005; **P<0.001. (E) Representative fluorescent images of primary epicardial cell cultures. E12.5 hearts of the indicated genotype were isolated and cultured on collagen-coated coverslips for 3 days. Heart explants were then removed and adenovirus for Cre expression (AdCre) added to the cultures. After 2 days, cells were fixed and stained with phalloidin and anti-β-catenin antibody to visualize actin stress fibers and cellular junctions, respectively. Nuclei were detected with DAPI. (F) IHC for Wt1 in left ventricle of the indicated genotype. Images were taken in a 66× field of view and Wt1+ cells in the subepicardium and ventricle were quantified. Arrowheads illustrate cells that would be quantified. Cropped images of quantified regions are shown. Induction by tamoxifen was at E12.5 and hearts were isolated after 24 hours. (G) Quantification of Wt1+ cells in F. Wt1+ cells in the myocardial compartment of the left ventricle were counted in 66× field-of-view images. Data are mean ± s.d. n values are indicated in parentheses. *P<0.0001; **P<0.001; ***P<0.05; ns, no significant difference. FOV, field of view. Scale bars: 200 μm in A; 50 μm in C,E,F.

