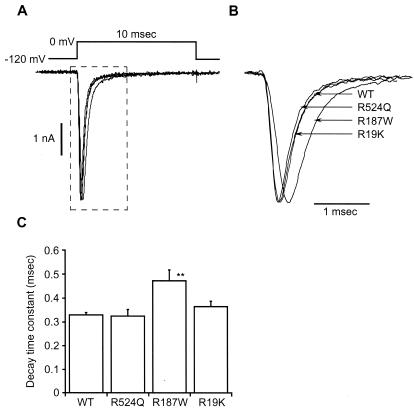
Figure 3.
Differences in the kinetics between WT and mutant sodium channels. (A) Sodium currents of WT and mutant Na+ channels. Currents were induced by a step depolarization to 0 mV from a holding potential of −120 mV. (B) Enlargement of the area within dashed line in A. Peak amplitudes were 5.2 nA for WT, 3.9 nA for R524Q, 4.4 nA for R187W, and 4.1 nA for R19K. The peak currents were normalized. (C) Time constant of the decay during a step depolarization. Current decay was fitted by a single exponential function. The decay time constant was significantly slower in R187W channels than in WT, R19K, or R524Q channels. Each point is given as mean ± SEM (n = 7). Statistical test was done by ANOVA. **, the statistical difference at 1% level.

