
Figure 3. The effect of cis vs. trans isomer FA sidechains on γ-secretase processivity.
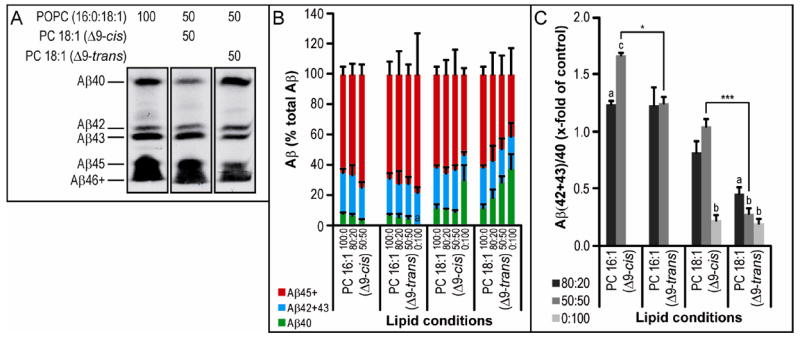
Activity assay samples were run on bicine/urea gels, transferred to PVDF, then probed for human Aβ (using 6E10 antibody). A) Part of one blot is shown as an example. B) All blots were analyzed by densitometry and the results plotted as a percentage of the sum of all Aβ bands in a lane in groups of Aβ40 (green bars), Aβ42+Aβ43 (blue bars), and Aβ45+Aβ46+ (red bars). C) Ratios of Aβ(42+43)/Aβ40 were calculated from the densitometry data. Ratios below denote the percentage of POPC and specific FA chain being tested. Where no bar is shown, band intensity was too low for detection by Western blot. Statistical analysis was performed as in Figure 2 (n = 3).