
Figure 3.
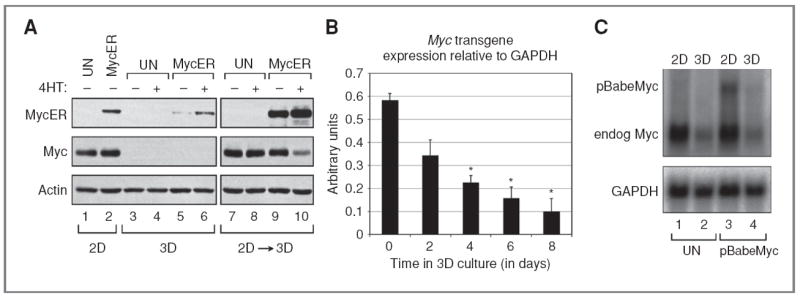
Endogenous and transgenic Myc expression is reversibly reduced in 3D cell cultures. A, Western blot showing Myc ER and Myc expression in 2D, 3D (day 16), and replated (3D → 2D) MCF10A cells, relative to actin, in untransduced (UN) MCF10A cells or in MCF10A cells transduced with pBabeMycER. MCF10A cells were treated with either tamoxifen (4HT; +) or vehicle control (−) while in 3D culture or after replating on 2D. B, time course of transgenic Myc transcripts in 3D culture quantified by qRT-PCR. Exonic Myc transcripts were quantified in MCF10A acini expressing an MSCV-based retroviral Myc transgene. For each sample, the Myc signal from MCF10A acini expressing an empty vector (endogenous transcripts) was subtracted to calculate Myc transgene expression relative to glyceraldehyde-3-phosphate dehydrogenase (GAPDH). Error bars, ±1 SEM (Student t test compared with day 0: *, P < 0.0125; n = 2). C, Northern blot showing expression of transgenic Myc (pBabeMyc LTR) and endogenous (endog) Myc relative to GAPDH in untransduced MCF10A cells or in MCF10A cells transduced with pBabeMyc in 2D or 3D (day 8) culture.