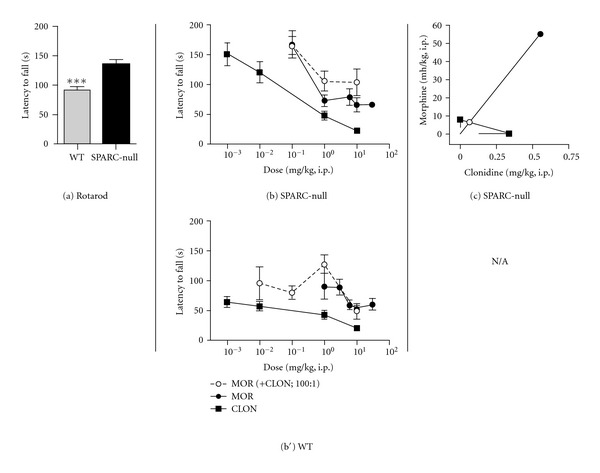
Figure 3.

Effect of coadministration of morphine and clonidine on motor function. (a) Saline-treated SPARC-null animals perform better on the rotarod assay compared to WT mice, indicative of an absence of motor impairment in SPARC-null mice. (b), (b′) In SPARC-null mice (b), morphine (●) and clonidine (■) dose-dependently caused motor impairment when administered systemically either alone or coadministered (i.p.) at a constant dose ratio of 100 : 1 (morphine : clonidine). In WT mice (b′), morphine (●) and clonidine (■) dose-dependently caused motor incoordination when administered systemically, but the combination lacked efficacy. (c) Isobolographic analysis applied to the data from Figure 1(b). The y-axis represents the ED50 for morphine, and the x-axis represents the ED50 for clonidine. The lines directed from each ED50 value toward zero represent the respective lower 95% confidence limits of each ED50. The line connecting these two points is the theoretical additive line. The open circle on the theoretical additive line represents the calculated theoretical ED50 value of the combination if the interaction is additive. The observed combination ED50 (●) was not significantly different (t-test) from the theoretical additive ED50 (∘), indicating that the interaction is additive. Isobolographic analysis was not performed in WT mice since the combination lacked efficacy in this assay. Error bars represent ±SEM for each dose point (n = 5–11 animals/dose). See Table 1 for ED50 values. ***P < 0.0001.
