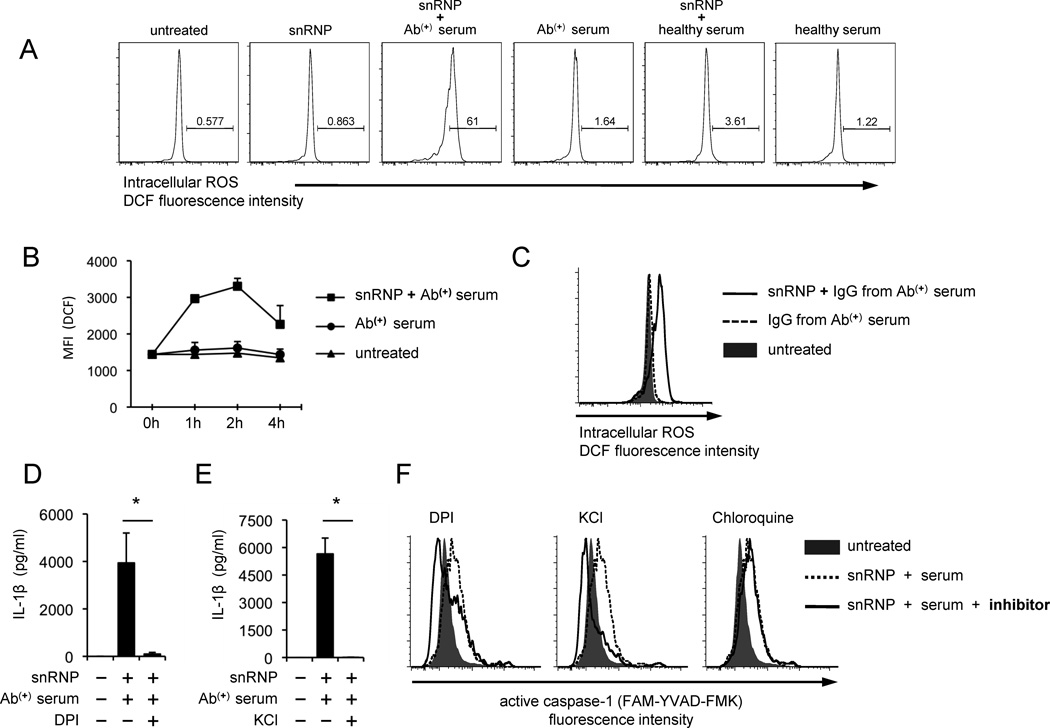
FIGURE 5. The production of IL-1β and activation of caspase-1 by human monocytes in response to U1-snRNP and anti-U1-snRNP antibody-positive serum requires ROS synthesis and K+ efflux.
(A–C) Flow cytometric analysis of reactive oxygen species (ROS) in monocytes stimulated for 3 (A) or indicated hours (B) with or without U1-snRNP (5 µg/ml) in the presence or absence of anti-U1-snRNP (snRNP) antibody-positive (Ab(+)) serum (5% final concentration), healthy serum (A–B) or total IgG purified from anti-U1-snRNP antibody-positive (Ab(+)) serum (C). (D–E) IL-1β ELISA of culture supernatants from monocytes incubated for 18 hours with U1-snRNP and anti-U1-snRNP antibody-positive (Ab(+)) serum in the presence or absence of the ROS inhibitor DPI (D) or KCl (E). (F) Flow cytometric analysis of active caspase-1 in monocytes treated for 7 hours with U1-snRNP and anti-U1-snRNP antibody-positive (Ab(+)) serum in the presence or absence of DPI, KCl or chloroquine. Representative data from 3–4 independent experiments (A, C, F). Symbols and error bars indicate mean + SD (n = 2) (B). Bars and error bars indicate mean and SEM, respectively (n = 4–7 donors for D–E). *P < 0.05.

