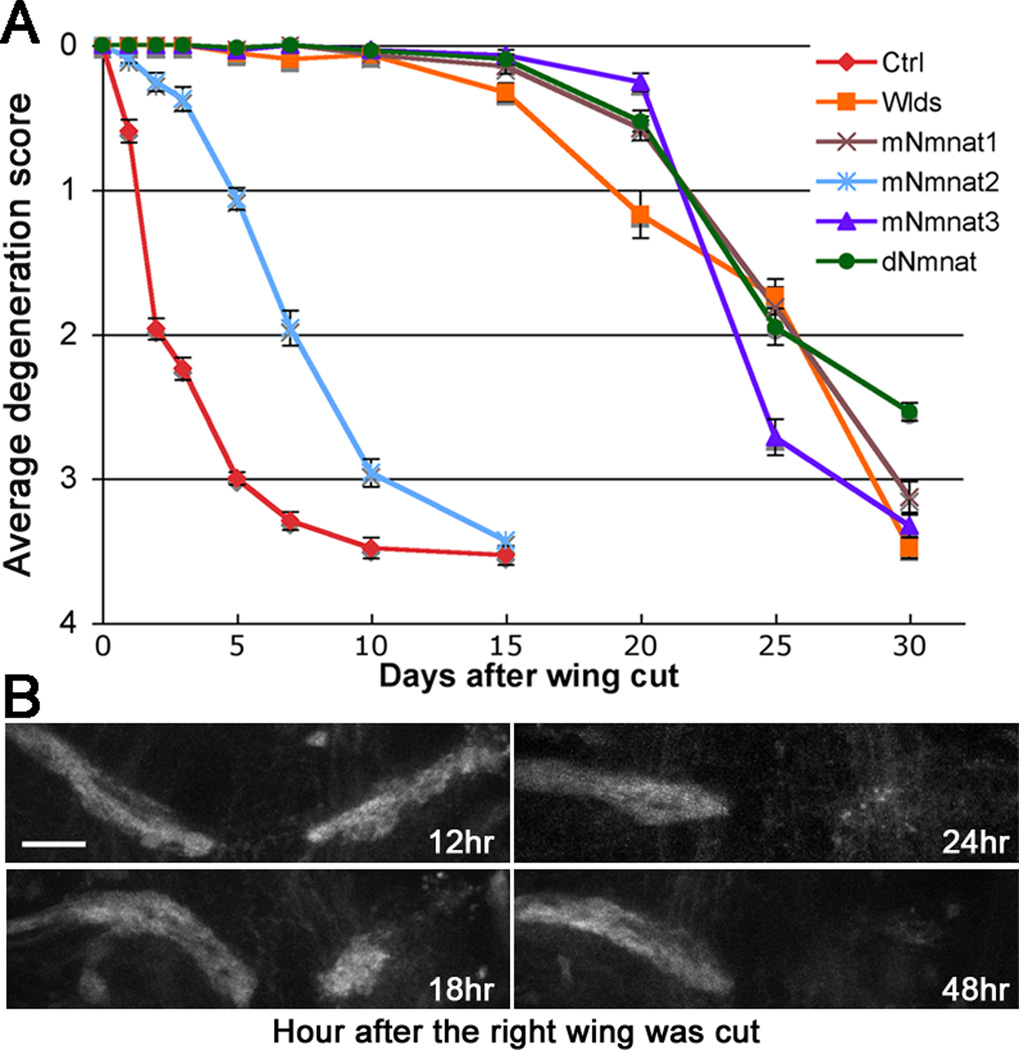
Figure 2. Time course of injury-induced axon degeneration in the wing cut model.
(A) Axon degeneration scores (see Figure S2B) of flies expressing UAS-Luciferase (Ctrl) or Wlds, mNmnats, or dNmnat at indicated time after injury. Mean ± SEM is shown, n = 22~35. (B) The thoracic projection was examined at indicated time after the right wing was cut. The left wing was uncut and its projection was used as an internal control. Scale bar: 20 µm.

