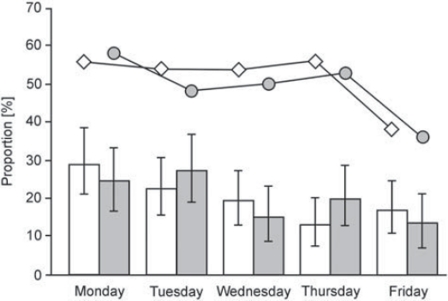
Figure 2.
Patients’ attendance related to weekdays.
Notes: The percentage of work attendees visiting on different weekdays in Poland (n = 125) and Norway (n = 107) are shown as bars (in white and grey respectively) with 95% confidence interval (CI). The proportions that were sick-listed (n = 65 in Poland and n = 54 in Norway) on the different days are shown as lines.

