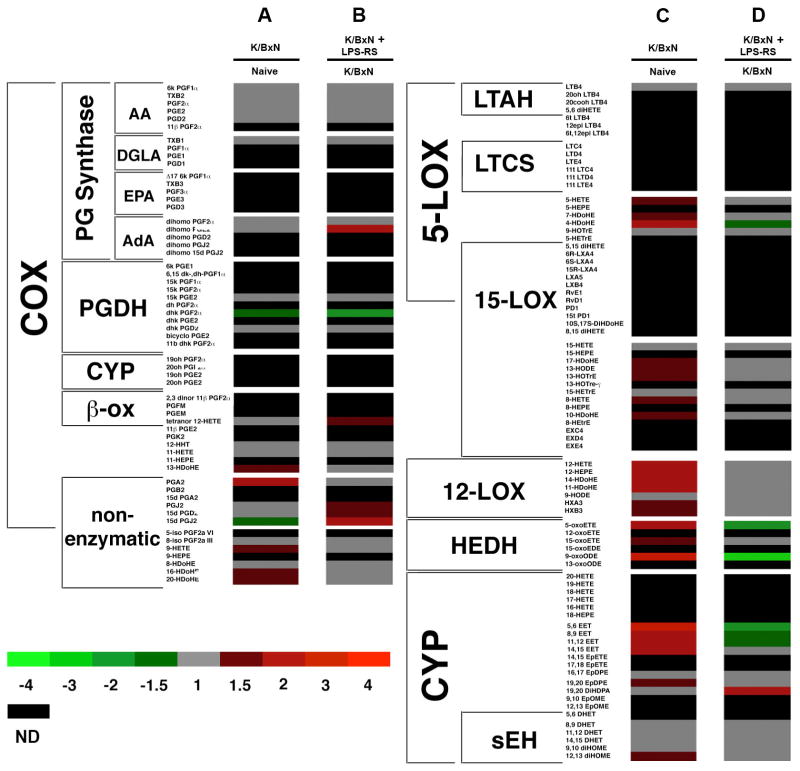
Figure 7.
Heat map displaying the relative fold-changes in the eicosanoid profile. (A and C) The changes in the eicosanoid profile in day 6 K/BxN serum transfer arthritic mice with respect to non-arthritic control mice. (B and D) A direct comparison between the relative eicosanoid levels detected in the lumbar spinal cords of day 6 arthritic mice treated with IT LPS-RS vs day 6 arthritic mice treated with IT saline. Columns A and B display COX products while C and D display LOX and CYP products. This analysis was determined from non-arthritic control (n=8), arthritic + IT saline (n=7), and arthritic + IT LPS-RS (n=8) mice. ND (black) indicates that the eicosanoid was either not detected or below our level of detection.

