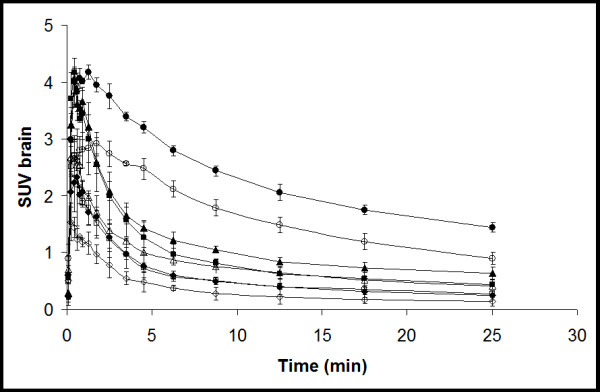
Figure 3.

Average cerebral [11C]flumazenil SUV in rats as function of time. Circles, triangles, squares and diamonds indicate the different dose levels of (unlabeled) flumazenil administered, e.g., 4 (circle), 20 (triangle), 100 (square), and 400 μg (diamond). Open and closed symbols indicate data before and after tariquidar treatment, respectively. Error bars represent SD.
