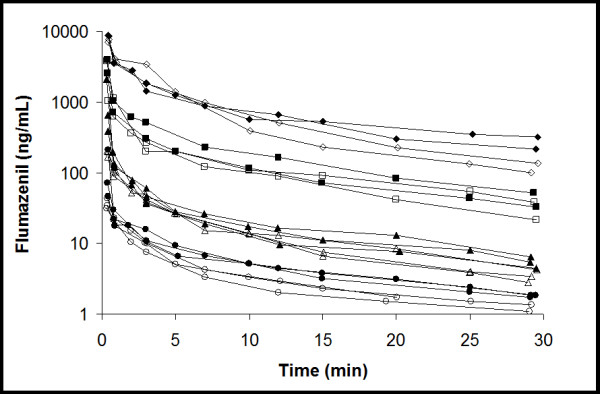
Figure 4.

Average flumazenil plasma concentrations in rats. Circles, triangles, squares and diamonds indicate different dose levels of flumazenil administered, i.e., 4, 20, 100 and 400 μg, respectively. Open and closed symbols indicate data before and after tariquidar treatment, respectively.
