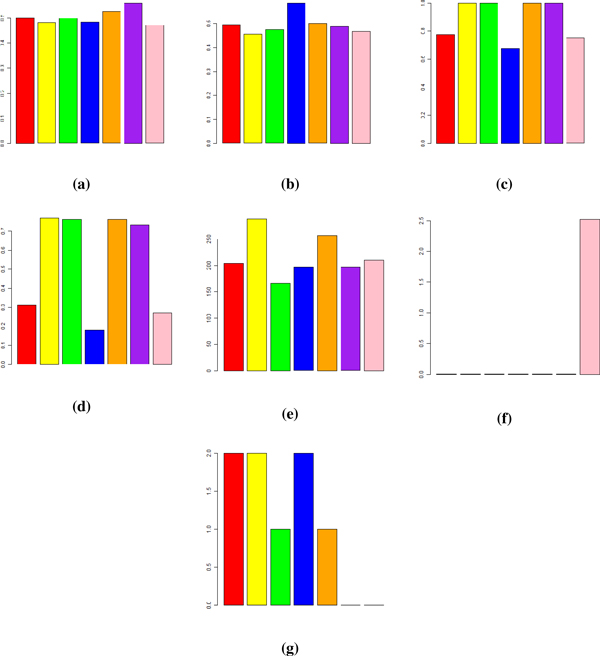
Figure 7.
Overview of results. An overview of the results of the data merging evaluation methods used in this study for SVM classification with leave-dataset-out (a) and stratified percentage folding (b), PVCA analysis (c), clustering (d), SAM (e), RFE-SAM overlapping (f) and enrichment analysis (g). The bars in each plot refers to RMA (red), CB-RMA (yellow), ZS-RMA (green), MBEI (blue), CB-MBEI (orange), ZS-MBEI (purple) and fRMA (pink) respectively.

