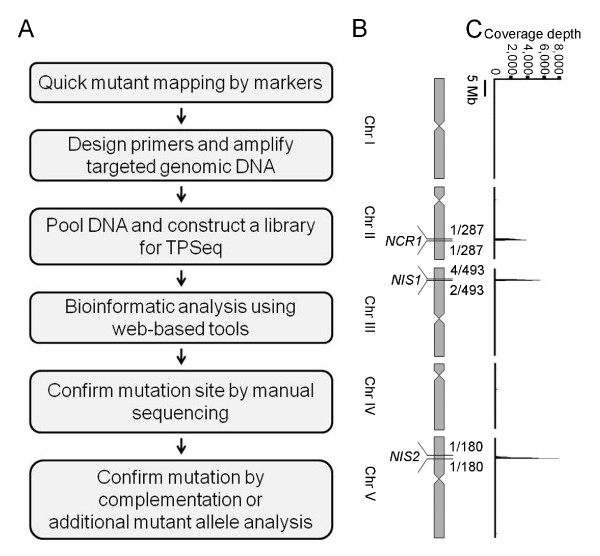
Figure 2.
Identifying mutations by TPSeq. A. Flowchart of the TPSeq procedure. B. Physical map of mutations on Arabidopsis chromosomes. Three mutants were mapped to different chromosomes with the numbers of recombinants and nearest markers. C. Coverage plot from TPSeq. Y-axis is the average read of 100 kb window. X-axis is the corresponding location on chromosome shown in B

