
Figure 1.
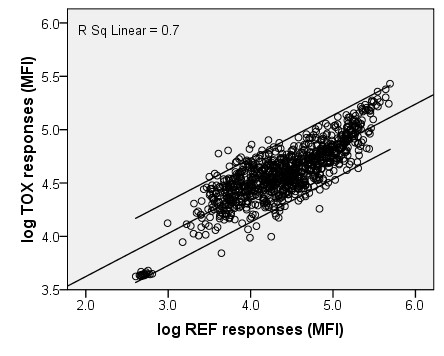
Estimation of T. gondii non-specific binding correction factor. Log transformed responses of T. gondii negative swine field sera on non-coupled beads (x-axis) versus T. gondii coupled beads (y-axis). Linear regression line (log y = 0.404* log x + 2.818), 95%CI lines and the linear R2 are presented.