
Figure 3.
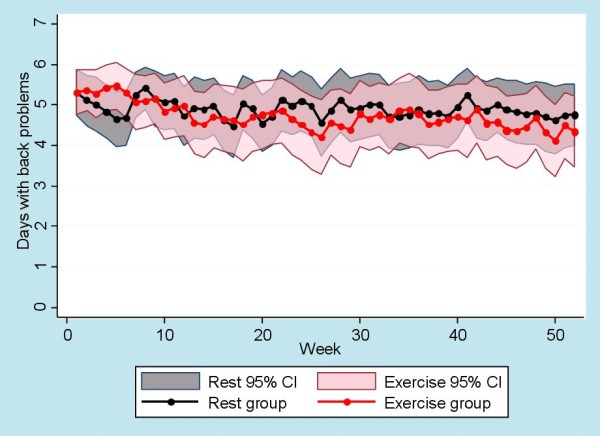
SMS-Track of low back problems. SMS-Track data showing means and CI for number of days with low back problems for both groups. The CI of the rest group is colored grey and is visible behind the transparent pink CI of the exercise group.
Official websites use .gov
A
.gov website belongs to an official
government organization in the United States.
Secure .gov websites use HTTPS
A lock (
) or https:// means you've safely
connected to the .gov website. Share sensitive
information only on official, secure websites.
SMS-Track of low back problems. SMS-Track data showing means and CI for number of days with low back problems for both groups. The CI of the rest group is colored grey and is visible behind the transparent pink CI of the exercise group.