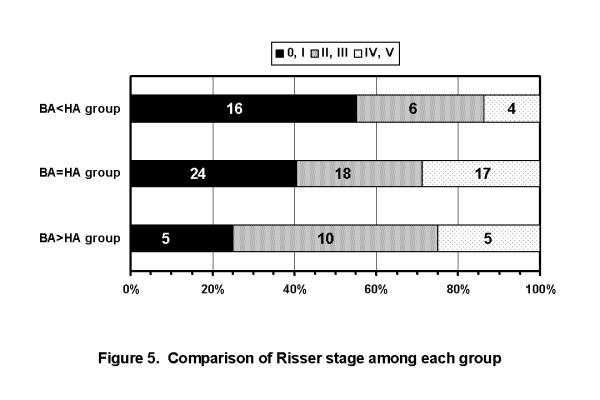
Figure 5.

Comparison of Risser stage among each group. The rates of Risser 0 or I cases were 55.2% in BA < HA group, 40.7% in BA = HA group, and 25.0% in BA > HA group, respectively. Maturity in BA < HA group was the lowest among each of them. (BA: Cobb angle on initial brace wearing, HA: Cobb angle in hanging position).
