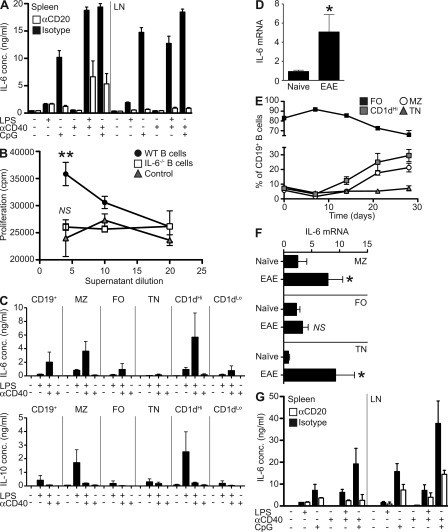
Figure 1.
B cells from naive and EAE mice are a major source of IL-6 which stimulates T cells in vitro. (A) Whole splenocyte and lymph node cells were isolated from mice after B cell depletion or isotype control treatment. IL-6 levels were quantified by ELISA after 72 h of stimulation with LPS, CpG, and/or anti-CD40. Bars represent the mean of groups of five mice and are representative of two independent experiments. (B) Supernatants from LPS- and anti-CD40–treated WT B cells, IL-6−/− B cells, or cell-free controls were added to sorted CD4+ T cells in the presence of anti-CD3 and anti-CD28. Proliferation was determined by thymidine incorporation after 72 h. Data points represent the means of triplicate cultures of cells pooled from two mice, with error bars the SEM. Results are representative of two independent experiments. Statistical analysis is by two-way ANOVA, where **, P < 0.01. (C) B cell subsets were isolated from spleens of naive mice by magnetic and FACS sorting based on CD19, CD21, CD23, and CD1d expression. After in vitro stimulation for 24 h with LPS and/or anti-CD40, IL-6 (top) and IL-10 (bottom) levels in supernatants were quantified by Bioplex. Histograms represent mean cytokine production from triplicate cultures of cells pooled from four to eight mice. Error bars represent SEM. Comparison between subsets stimulated with LPS and CD40 is by Student’s t test; MZ versus FO, P = 0.0156 and CD1dHi versus CD1dLo, P = 0.0352. Data presented are combined from nine independent experiments. (D) RT-PCR for IL-6 mRNA was performed on pooled B cells sorted directly ex vivo from naive and EAE (at day 14) mice. Data presented is combined from two independent experiments. Histograms represent mean mRNA expression from triplicate samples obtained from pooled cells from 10 mice. Error bars represent SEM. Statistical analysis is by Student’s t test, where *, P < 0.05. (E) Kinetics of B cell subset expansion during EAE were assessed by flow cytometry. Each point represents the mean of 6–12 mice, with error bars the SEM. Data are representative of two separate experiments. (F) RT-PCR for IL-6 mRNA was performed on sorted B cell subsets as indicated. Data presented is combined from two independent experiments. Comparisons between naive and EAE B cells for each subset was statistically analyzed by Student’s t test, where NS, P > 0.05 and *, P < 0.05. (G) Splenocyte and draining lymph node cells were isolated from EAE mice (at day 14) after treatment with isotype control or anti-CD20 at day 10. IL-6 was quantified Bioplex on supernatants after 72 h of stimulation with LPS, CpG, and anti-CD40. Bars represent the mean on duplicate samples pooled from five mice and are representative of three independent experiments.

