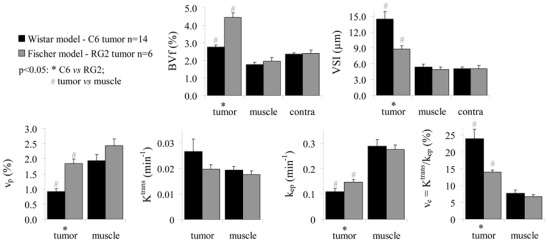
Figure 4. DCE MRI pharmacokinetic parameter estimates obtained in presence or in absence of USPIO.

The pharmacokinetic parameters obtained in Session 1 (USPIO−, black) and in Session 2 (USPIO+, gray) are represented as mean±SEM. Data obtained in the muscle have been pooled across tumor models (n=20) while data from the C6 tumor and the RG2 tumor were kept separated (n=14 and n=6 respectively).
