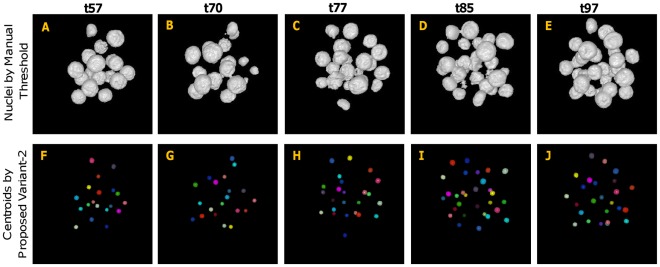
Figure 9. Results for centroid extraction by proposed method (Variant-2) for higher time–point images.
(A–E) Preprocessed and manually thresholed 3D images (volume rendered) for time points t57, t70, t77, t85, and t97, respectively. (F–J) Corresponding results of centroid extraction. All individual centroids are represented by spherical regions using different colors.

