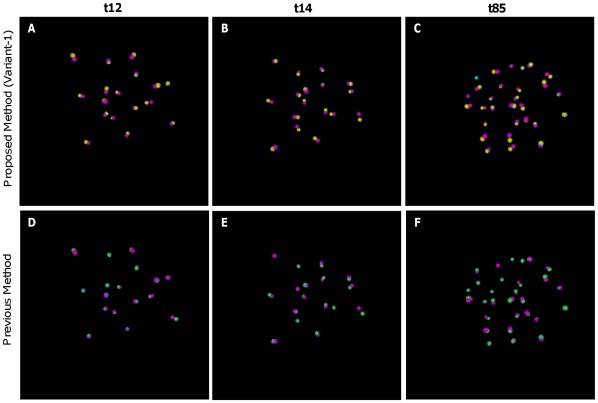
Figure 10. Visual comparison of estimated centroids with corresponding ground–truth centroids.
Volume rendered view of the estimated and ground-truth centroids for images at time point (A, D) t12, (B, E) tp14, and (C, F) t85, respectively. Top row shows the results by our method, while bottom row shows the same by the method, proposed by Bao et al. Yellow and Green spheres show the estimated centroids by our and Bao’s methods, while pink spheres show ground–truth (GT) centroids. Blue color in the figures shows the overlapped regions between the estimated and GT centroids.

