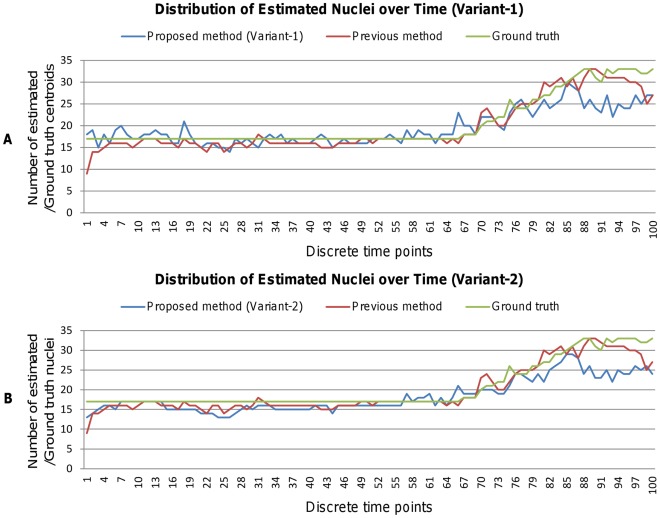
Figure 11. Results of number of estimated nuclei by our method.
Blue and red graphs show the plots of the estimated nuclei for (A) Variant-1 and (B) Variant-2 of our method and Bao’s method, respectively. The green graph shows manually identified GT centroids. These plots involve 100 3D images, captured at 100 discrete time points in the early developmental period of mouse–embryo.

