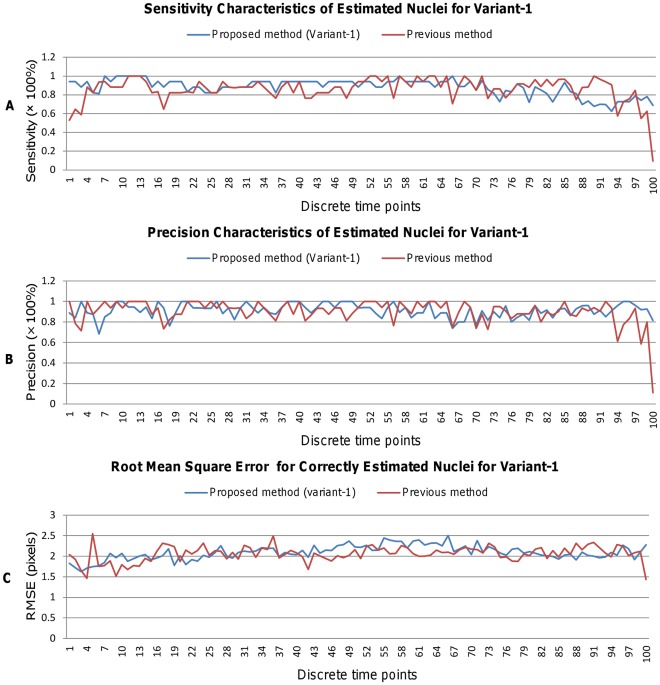
Figure 12. Comparison of Sensitivity, Precision, and RMSE metrics for estimated nuclei (Variant-1).
Performance of nuclei detection over 100 time points (i.e., 100 3D images) in terms of (A) Sensitivity, (B) Precision, and (C) Root Mean Square Error (RMSE). Blue and red graphs show the performance curves for our proposed and Bao’s method, respectively.

