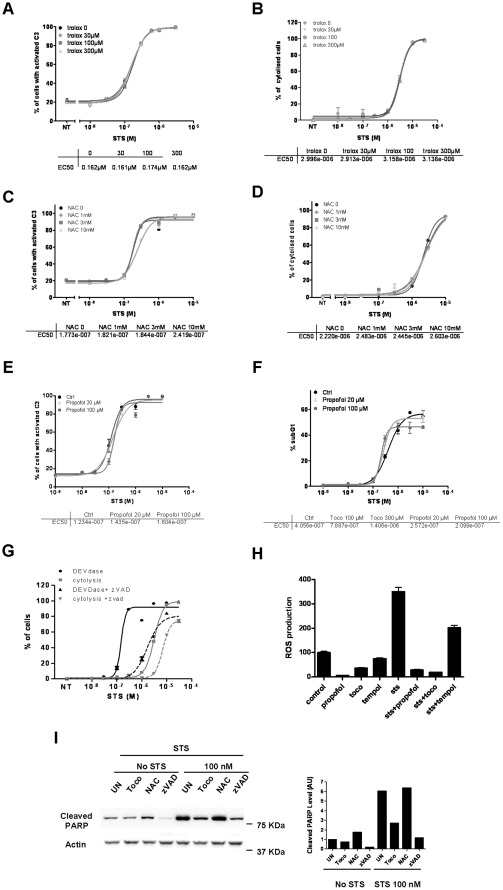
Figure 2. α-tocopherol protects from staurosporine-induced cell death independently of its antioxidant properties.
When co-treatments were needed, antioxidants were added simultaneously to STS. A, C, E HeLa cells stably expressing a C3/7-DAP were treated with increasing amounts of STS in presence or not of different concentrations of trolox (A), NAC (C) or propofol (E). Dose response curves were established accordingly and EC50 values are presented below the curves. B, D HeLa cells were treated for 24 h with increasing amounts of STS in presence or not of trolox (B) and NAC (D) before measuring the percentage of cytolyzed cells using EMA staining. Dose response curves and EC50 values are shown below. F HeLa cells were treated with increasing amounts of STS in presence or not of propofol for 24 h. The percentage of subG1 cells was quantified after propidium iodide staining and dose response curves done accordingly. EC50 values are shown below. G DEVDase activity- and cytolysis- dose response curves in response to STS with or without the addition of zVAD, a pan caspase inhibitor. The number of cells was determined 24 h post-drugs treatment. H Quantification of ROS production in HeLa cells treated with vehicle or 30 nM of STS in presence or not of different antioxidants such as propofol (30 µM), α-tocopherol (100 µM), and tempol (100 µM) measured 24 hours after treatment using DCFDA as described in Materials and Methods. I Hela cells were treated with DMSO or 100 nM of STS in presence or not of 100 µM of α-tocopherol, 10 mM of NAC or 100 µM of zVAD for 24 hours. Apoptotic cell death was then evaluated by immunoblotting using an anti-cleaved PARP antibody. Actin was used as a loading control.

