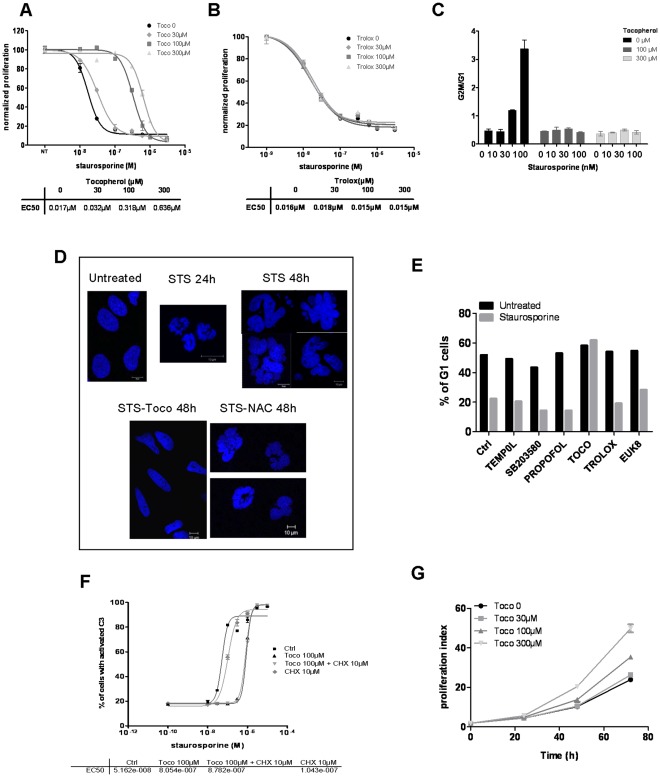
Figure 3. α-tocopherol prevents staurosporine-mediated cell cycle arrest in an antioxidant independent manner. A, B.
DiI-stained HeLa cells were treated with increasing amounts of STS supplemented with vehicle or 30, 100 and 300 µM of αtocopherol (A) or trolox (B) for 48 hours. Cell proliferation dose response curves were established from the median intensity fluorescence of DiI obtained for each point and normalized to the untreated control cells. EC50 values are shown in the table below the curves. C HeLa cells, co-treated with STS (1, 10, 30, 100 nM) and α-tocopherol (0, 100 or 300 µM) were stained with propidium iodide and cell cycle profile was determined by flow cytometry. The ratio of the percentage of cells in G2M on the percentage of cells in G0G1 was calculated and is shown here as a measure of the cell cycle profile variation. D HeLa cells were co-treated with 0.1 µM of STS and vehicle, α-tocopherol (100 µM) or NAC (3 mM) for 24 h or 48 h. Cells were fixed and colored with Hoechst. Images were acquired using the LSM510 confocal microscope. E HeLa cells were left untreated (black bars) or treated with 100 nM of STS for 24 h (grey bars). Antioxidants (100 µM of tempol, 10 µM of SB203580, 100 µM of propofol, 100 µM of α-tocopherol, 100 µM of trolox or 50 µM of euk8) were added simultaneously to STS. The percentage of cells in G0G1 phase was measured after propidium iodide staining and reported in the graph. F Dose response functions was obtained for STS in response to α-tocopherol treatment (100 µM) in presence or not of cycloheximide (CHX 10 µM) in a clone of HeLa cells stably expressing a C3/7-DAP. EC50 values were determined and presented in the table below the dose-response curves. G Growth curves of HeLa cells stained with DiI and treated with vehicle or 30, 100 and 300 µM of α-tocopherol for 24, 48 and 72 hours. Proliferation index was determined as described in the materials and methods section.

