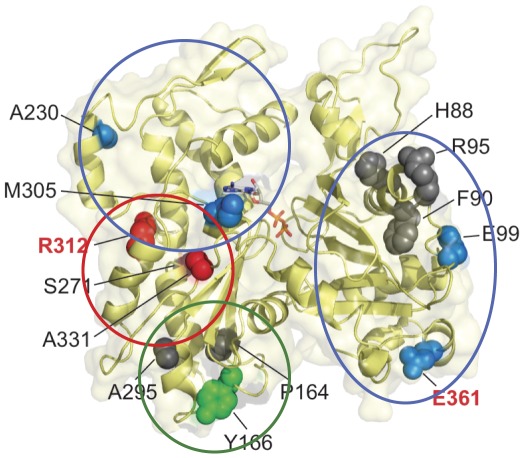
Figure 5. Correlation of location and effects of ACTC mutations.
The locations of ACTC mutations associated with cardiomyopathies are shown in black (HCM) and red (DCM) letters. The regions of molecular effects are circled and spacefilling models presented in red (protein stability changes), green (actin polymerization changed), and blue (no significant intrinsic property changes). Those residues shown in grey have not been characterized. Coordinate data for ATP-bound TMR-actin (1J6Z) [39] were visualized using PyMol [40].

