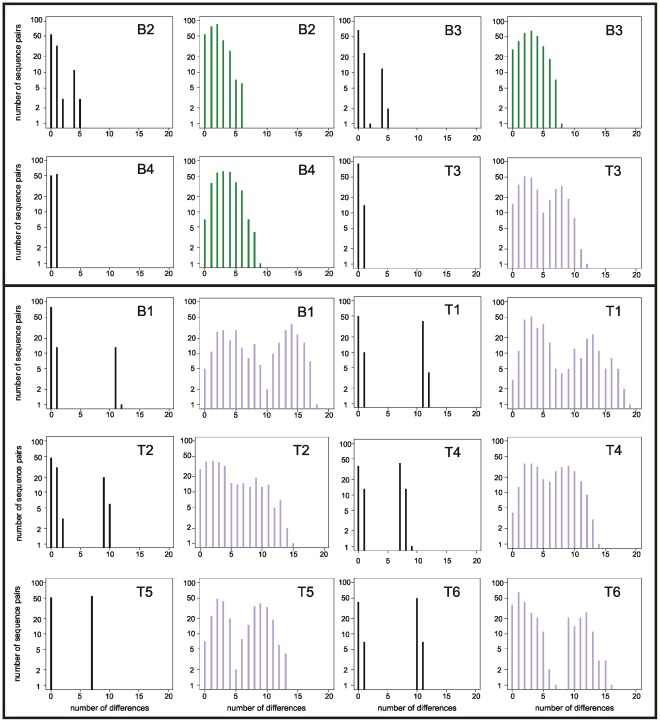
Figure 1. Mismatch distribution analyses of EPD-PCR and clone sequence datasets.
Individuals are ordered such that first four individuals with a single infection (as determined by EPD-PCR) are shown (B2, B3, B4 and T3; above the bar) followed by individuals with super-infections (below the bar). Plots are paired for each individual with the EPD-PCR dataset on the left and the bulk-PCR clone dataset on the right. EPD-PCR distributions are black; bulk-PCR clone distributions identified as unimodal (ΔAICc<2) are green; bulk-PCR clone distributions identified as bimodal are purple (ΔAICc>2).

