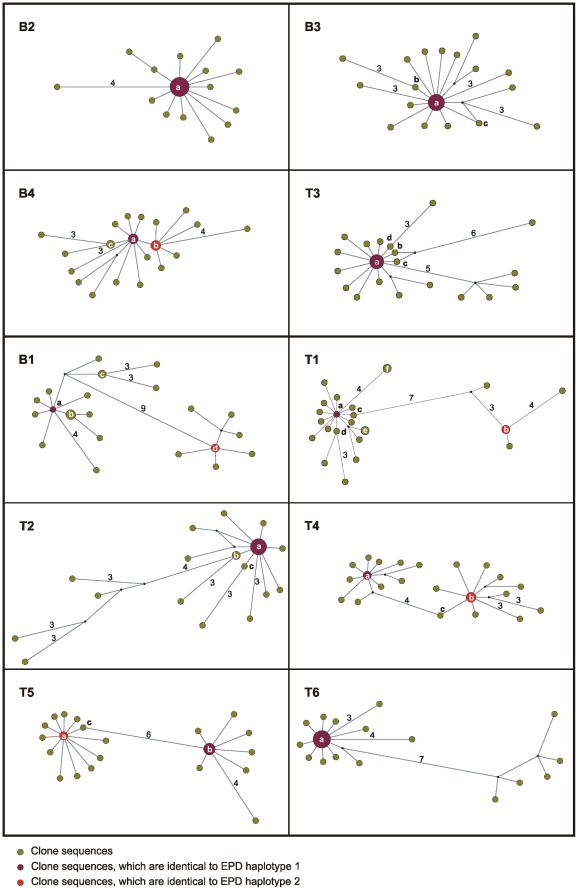
Figure 3. Median joining network of bulk PCR product clone sequences.
As in Figure 1, the networks are ordered by infection status. Within each network, node size is proportional to the frequency of sequence occurrence (total n = 25 for each individual). Branch lengths are directly related to the number of mutations between sequences, with values noted for differences greater than two base pairs. Clone haplotypes a–f (as shown in Table 1) are noted within or adjacent to their corresponding node. Networks generated using TCS were highly similar (data not shown).

