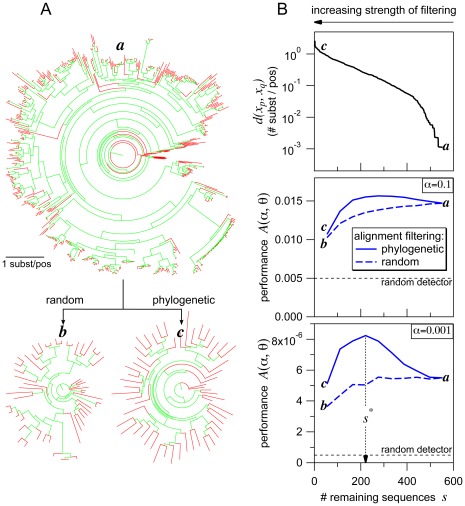
Figure 4. Influence of alignment filtering.
(A) Random filtering and phylogenetic filtering both remove sequences from the unfiltered alignment, which is represented by the large tree a, but result in trees (b and c) that differ in the length of terminal branches (red). Tree b (random filter) is similar to a in containing many extremely short terminal branches that are known to challenge coevolution detectors. In contrast, tree c (phylogenetic filter) lacks short terminal branches. (B) Opposing effects of progressively increasing strength of filtering, which leaves gradually fewer sequences in the alignment. The top graph shows, for the phylogenetic filter, the minimal sequence-sequence distance  among all sequence pairs in the filtered alignment. The two lower graphs show performance, measured by
  , of a coevolution detector for both the phylogenetic and random filter. The first effect, specific to the phylogenetic filter, is a rise of
  with increasing strength of filtering (decreasing number remaining sequences). This reflects the disappearance of short terminal branches, which in turn improves performance, until a maximum is reached around 250 sequences remaining. The second effect is the deterioration of performance with increasing strength of filtering, since fewer sequences provide less information for the coevolution detector. This effect is clearly seen for the random filter regardless of the number of remaining sequences but it becomes apparent for the phylogenetic filter only with strong filtering. Conditions: detector = MIp; protein family = ABC-C. Trees were plotted using FigTree v1.3.1 (http://tree.bio.ed.ac.uk/software/figtree/).

