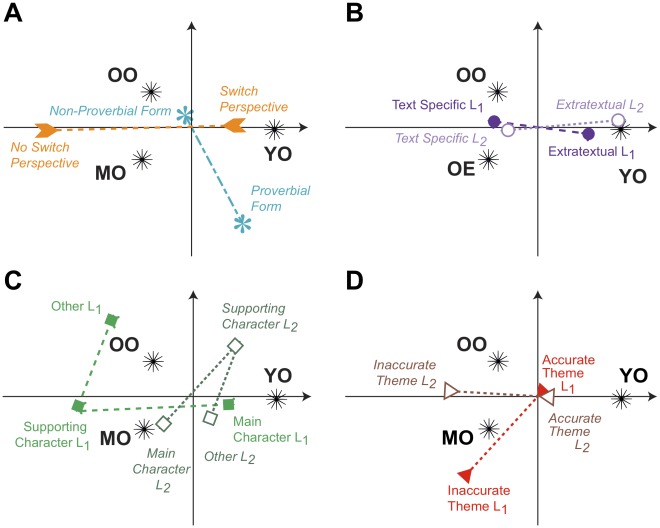
Figure 1. Discriminant correspondence analysis.
Variables shown along Factors 1 and 2. Lambda ( ) and tau (
 ) are the eigenvalues and the percentage of explained inertia (i.e., variance) for a given factor (
 ,
,  ;
;  ,
,  ). All sub-figures are plotted on the same scale along each factor. (A) Switch Perspective and Linguistic Form collapsed across both lesson types. Note that young elderly group switched perspectives between lesson types more frequently than the middle or old elderly groups. (B) Generalization Level for each lesson type. Note that the young elderly group produced extra-textual lessons more frequently. Extra-textual lessons incorporate information from outside of the text. (C) Character Viewpoint for each lesson type. Note that they young elderly group more frequently adopted the viewpoint of the main character for the best lesson (lesson 1) and the supporting character for the alternate lesson (lesson 2). (D) Representation of Theme was included as a supplementary element. Supplementary elements are variables that were not included in the calculations, but were projected into the space to see their placement along the factors. They are used to aid with interpretation. Note that the young elderly group more frequently produced lessons reflecting accurate fable themes for both lesson 1 and lesson 2. Note that in correspondence analysis, the eigenvalues are never greater than 1.

