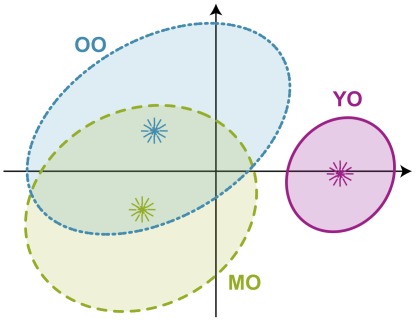
Figure 3. Discriminant correspondence analysis.
95% confidence intervals for age groups shown on factors 1 and 2. Lambda ( ) and tau (
 ) are the eigenvalues and the percentage of explained inertia (i.e., variance) for a given factor (
 ,
,  ;
;  ,
,  ). Confidence ellipses represent the variability within the group. Ellipses showing no overlap represent different populations. Note that in correspondence analysis, the eigenvalues are never greater than 1.

