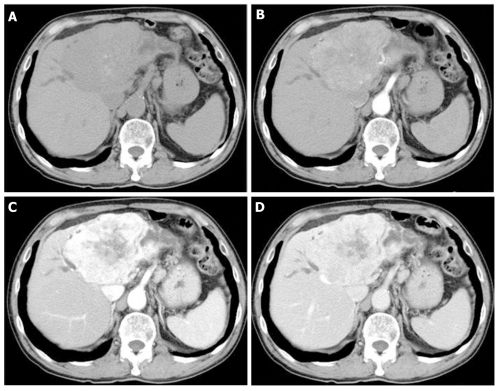
Figure 1.
Unenhanced and enhanced computed tomography images. A: Plain; B: Arterial phase; C: Equilibrium phase; D: Venous phase. Enhanced abdominal computed tomography scan showed a tumor of 92 mm × 61 mm in the left liver lobe, with dilatation of the peripheral bile duct. In addition, tumor showed more heterogeneous enhancement in the venous phase.

