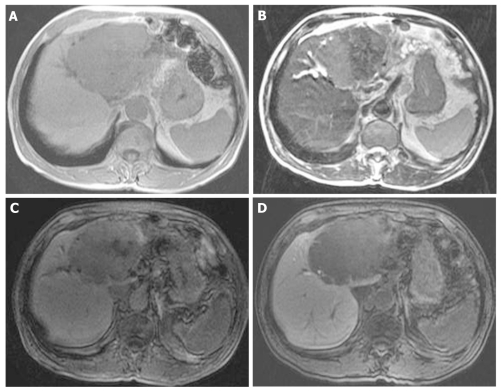
Figure 3.
Follow-up magnatic resonance image images after 7 years. A: Large tumor of left lobe showed low intensity on T1-weighted images; B: Large tumor of left lobe showed heterogeneous high intensity on T2-weighted images; C-D: Large tumor of left lobe showed relative hypointensity in comparison with normal liver parenchyma on equilibrium and hepatobiliary phase of contrast-enhanced EOB magnatic resonance image.

