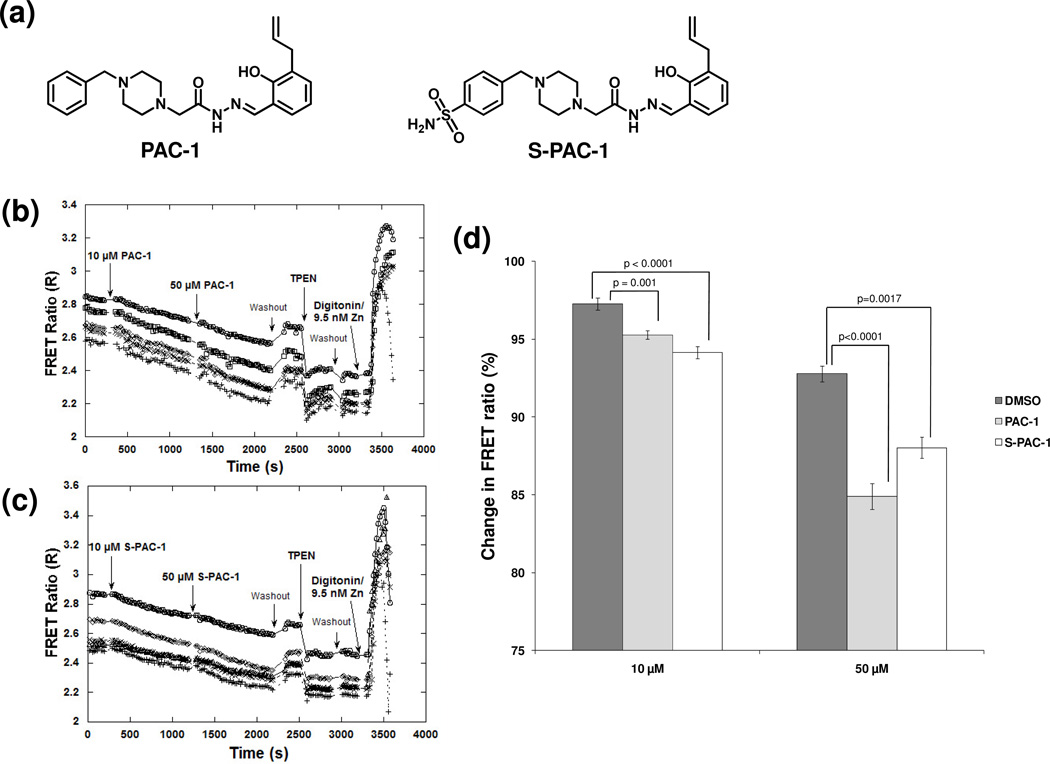
Figure 1. Changes in intracellular zinc concentration upon PAC-1 and S-PAC-1 treatment.
a) Structures of PAC-1 and S-PAC-1. FRET ratio changes in HeLa cells using the genetically-encoded zinc sensor ZapCY2. Graphs of a representative individual experiment show a decrease in intracellular free zinc in five cells treated with b)10 µM PAC-1 followed by 50 µM PAC-1, or c) 10 µM S-PAC-1 followed by 50 µM S-PAC-1. d) The decrease in intracellular zinc for both PAC-1 and S-PAC-1 is significant over multiple experiments. Error bars are standard error of the mean, p-values are from DMSO (10 cells or n=2 experiments), PAC-1 (21 cells or n=4 experiments), S-PAC-1 (14 cells or n=3 experiments).

