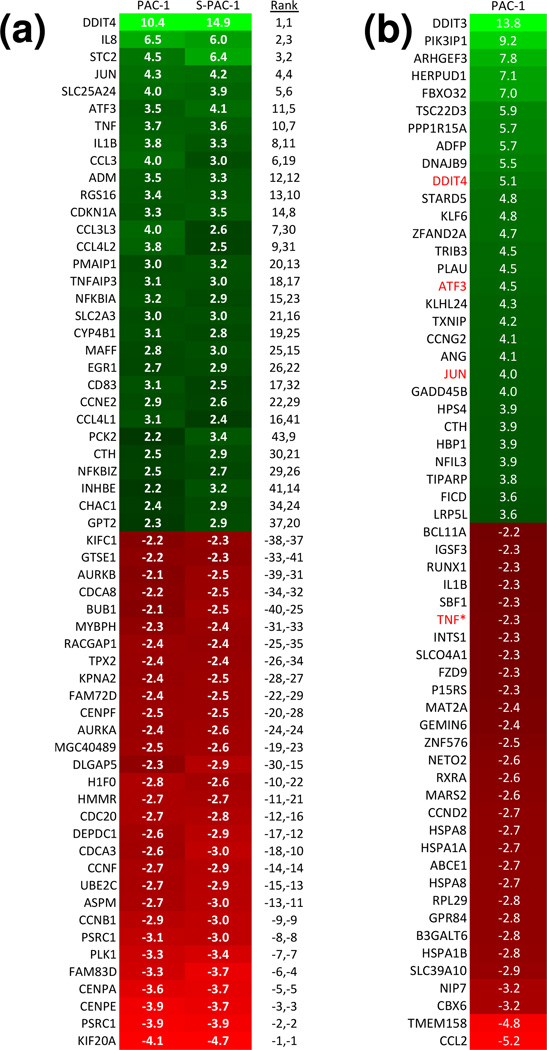
Figure 2. Expression profiles for PAC-1 and S-PAC-1.
a) HL-60 cells were treated with PAC-1 or S-PAC-1 at 25 µM for 6 hours. Shown are the most up- or down-regulated transcripts (p < 0.05) compared to DMSO control cells. White text: Fold-change values, black text: the ranks of transcripts in individual profiles. b) U-937 cells were treated with PAC-1 at 100 µM for 6 hours. Shown are the 30 most up- or down-regulated transcripts compared to DMSO control cells. White text: fold change values, red text: common genes with PAC-1 treatments at low (25 µM) concentrations. TNF (indicated with an *) is downregulated at high PAC-1 concentrations but shows upregulation at low PAC-1 concentrations.

