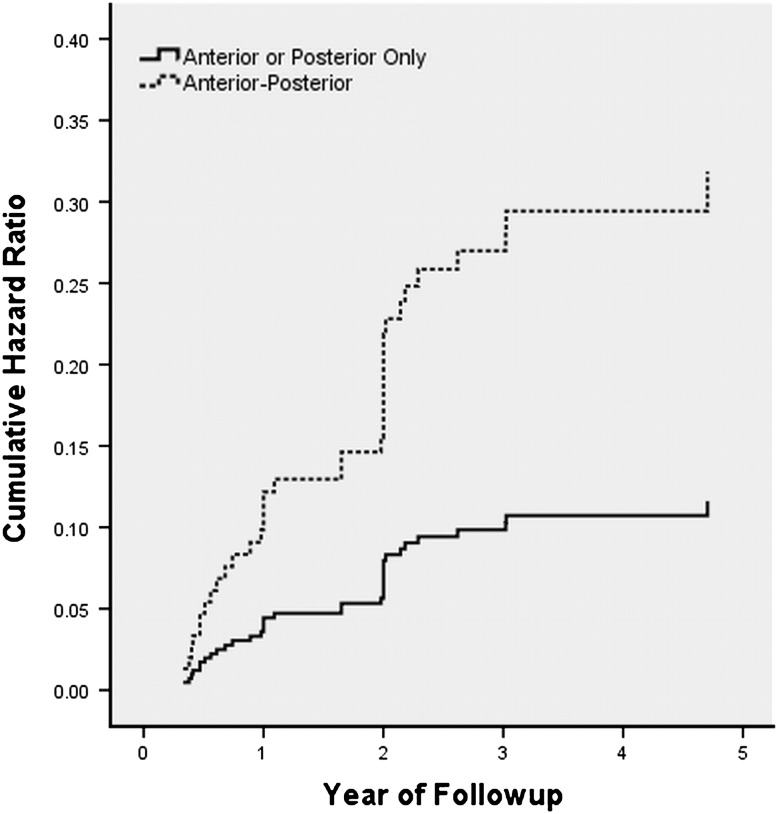
Fig. 1.
The graph shows a cumulative hazard plot for the development of PJK with stratification based on UIV. According to this model, those with proximal fusion levels ending at T1-T3 have a higher risk at all time points for developing PJK than those with fusions ending more distally in the T4-T12 region.

