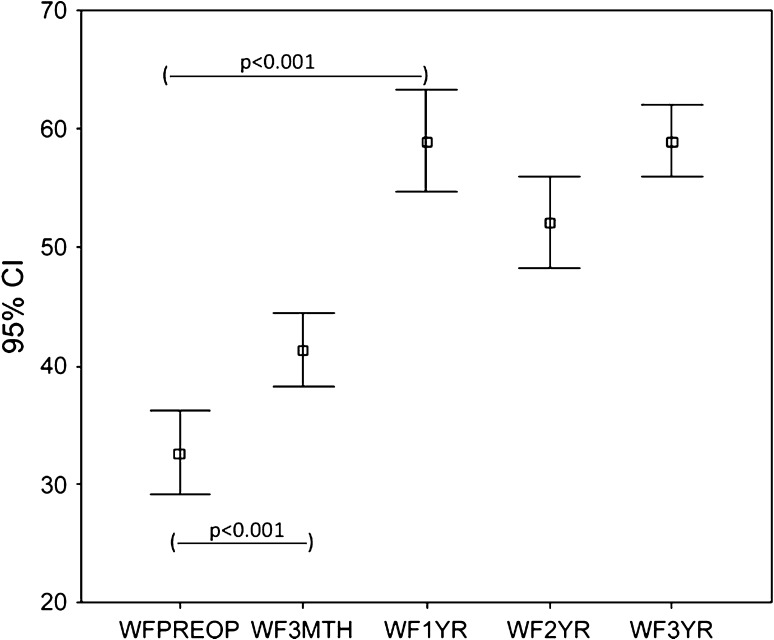
Fig. 2.
The trend for WOMAC function scores over 3 years for the whole group is shown. The scores increased at 3 months, reached a peak at 1 year, and then stabilized. WFPreop = preoperative WOMAC function score; WF3Mth = 3-month WOMAC function score; WF1 yr = 1-year WOMAC function score; WF2 yr = 2-year WOMAC function score; WF3 yr = 3-year WOMAC function score.

