
Figure 7. Increased incidence of Ca waves in myocytes from AnkB+/− vs. WT mice both under control conditions.
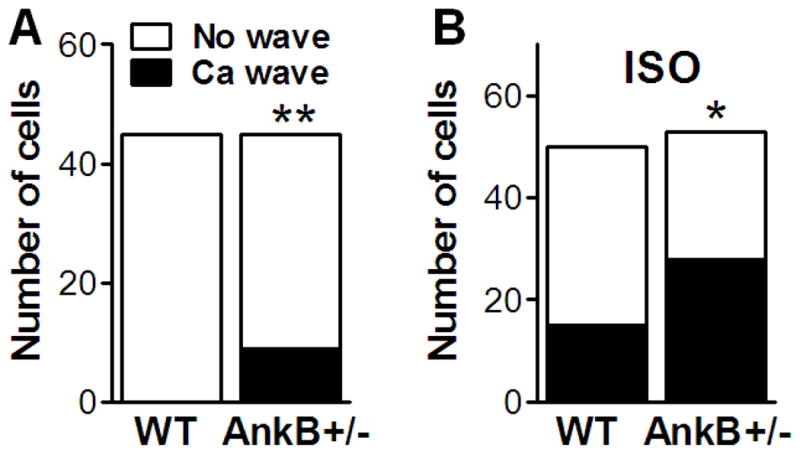
(A) and in the presence of 1 μM ISO (B). Shown is the number of cells that exhibited Ca waves for each group.
Official websites use .gov
A
.gov website belongs to an official
government organization in the United States.
Secure .gov websites use HTTPS
A lock (
) or https:// means you've safely
connected to the .gov website. Share sensitive
information only on official, secure websites.
(A) and in the presence of 1 μM ISO (B). Shown is the number of cells that exhibited Ca waves for each group.