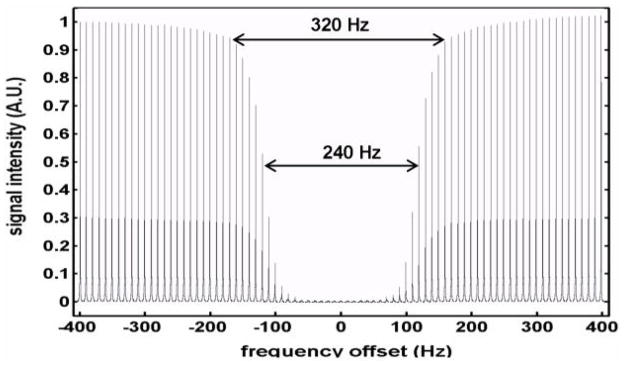
Fig. 1.
The frequency profile (±400 Hz with 10 Hz step) of the applied BISTRO saturation pulse trains was achieved through varying the carry frequency of the BISTRO saturation pulse trains. The measurements were conducted from a phantom ([Pi] = 200 mM). The frequency offset at 0 Hz means that carry frequency was on the resonance of Pi. The signal intensity in the plot was normalized to the NNR signal which was acquired with the same NMR pulse sequence and parameters except without BISTRO saturation pulse trains. The frequency width of 5% and 50% signal deduction was 320 and 240 Hz, respectively.

