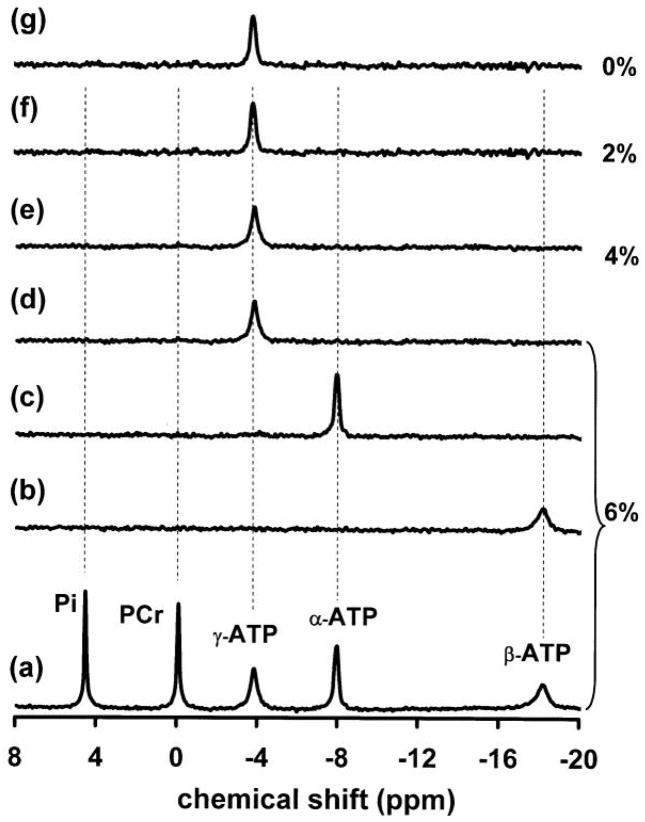
Fig. 3.
31P spectra acquired from phantoms with varied concentration of agarose. Spectra (a) to (d) were acquired from the phantom solution containing 6% agarose (maximum viscosity). Spectrum (a) was the control (in the absence of saturation) and spectra (b) to (d) were the differenced spectra between the control and spectra with the steady-state saturation of β-ATP (b), α-ATP (c) and γ-ATP (d), respectively. The different spectra (e) to (g) were obtained from the phantom solutions with 4% (e), 2% (f) and 0% (g) agarose, respectively, when γ-ATP was saturated.

