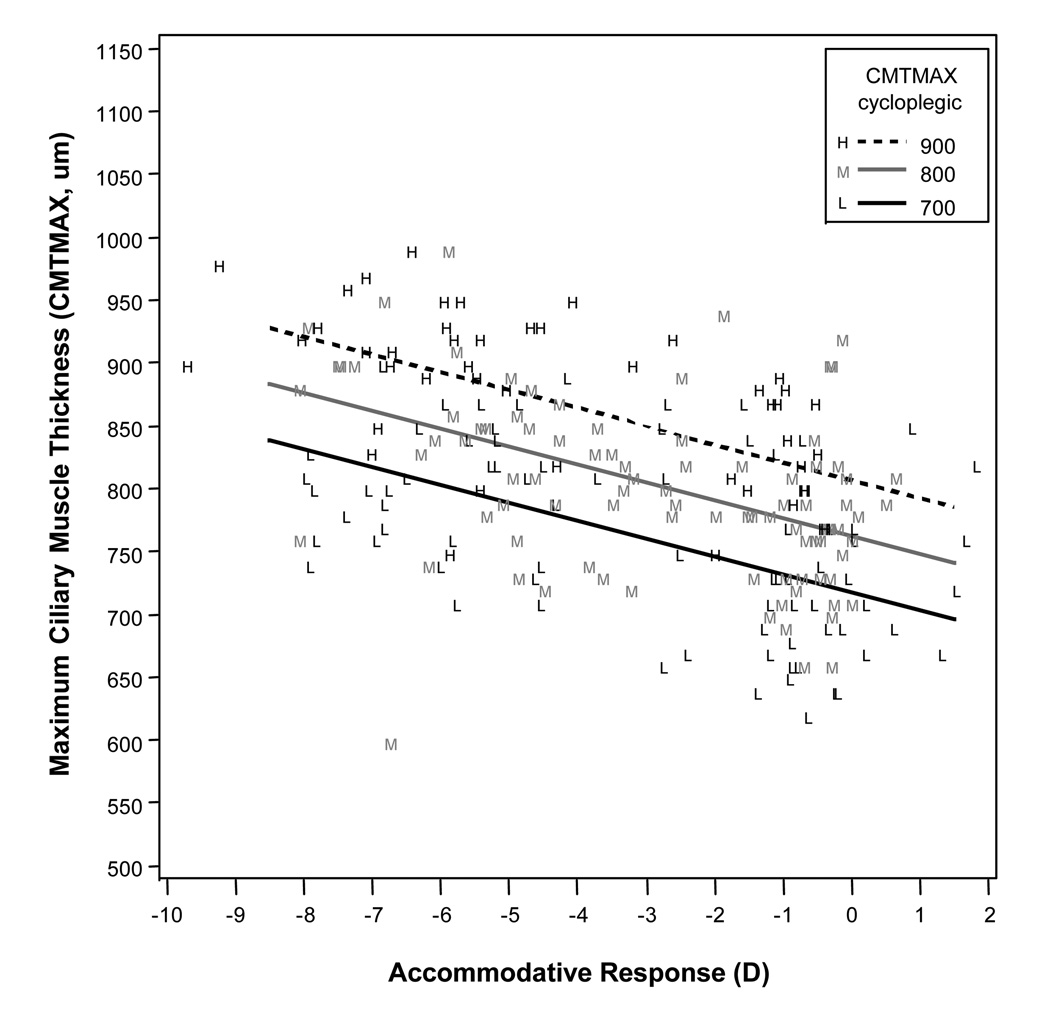
Figure 2.
Modeled results for maximum ciliary muscle thickness (CMTMAX) for a range of accommodative responses, showing that higher levels of accommodative response (more negative values) were associated with a thicker measurement at CMTMAX. Cycloplegic maximum ciliary muscle thickness (CMTMAX) was a statistically significant variable in the model, so the three lines represent three different cycloplegic ciliary muscle thicknesses across the range of our sample.

