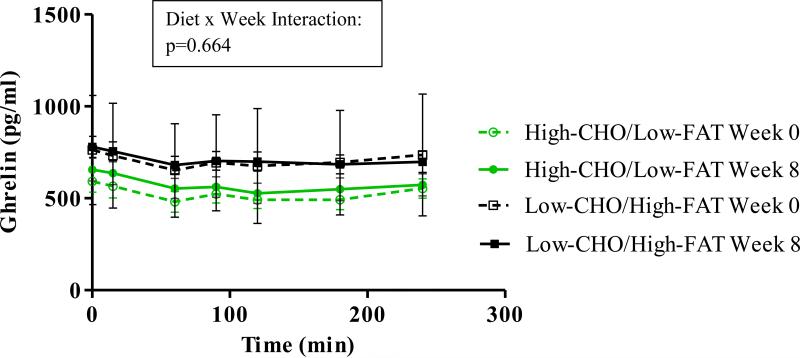
Figure 1.
Time courses for total serum ghrelin. Ghrelin changed across the minutes of each meal test (p<0.001 for both). The higher-CHO/lower-FAT group had lower ghrelin at baseline and week 8 (p<0.001 for Diet Group), but p-values were not significant for change over 8 weeks or Diet x Week interaction.

